Monitoring
AgentData gives operators two windows into a running system: the Dashboard (usage, cost and a health snapshot) and Monitoring (a live activity feed, split by subsystem — the Monitoring tab of the app's Settings & Monitoring section). Admins see their own tenant; super-admins see every tenant with a tenant filter.
The Dashboard
The Dashboard is the at-a-glance view. A time-range picker (24h / 7d / 30d / all) and — for super-admins — an all-tenants view with a per-tenant filter rescope everything on it.
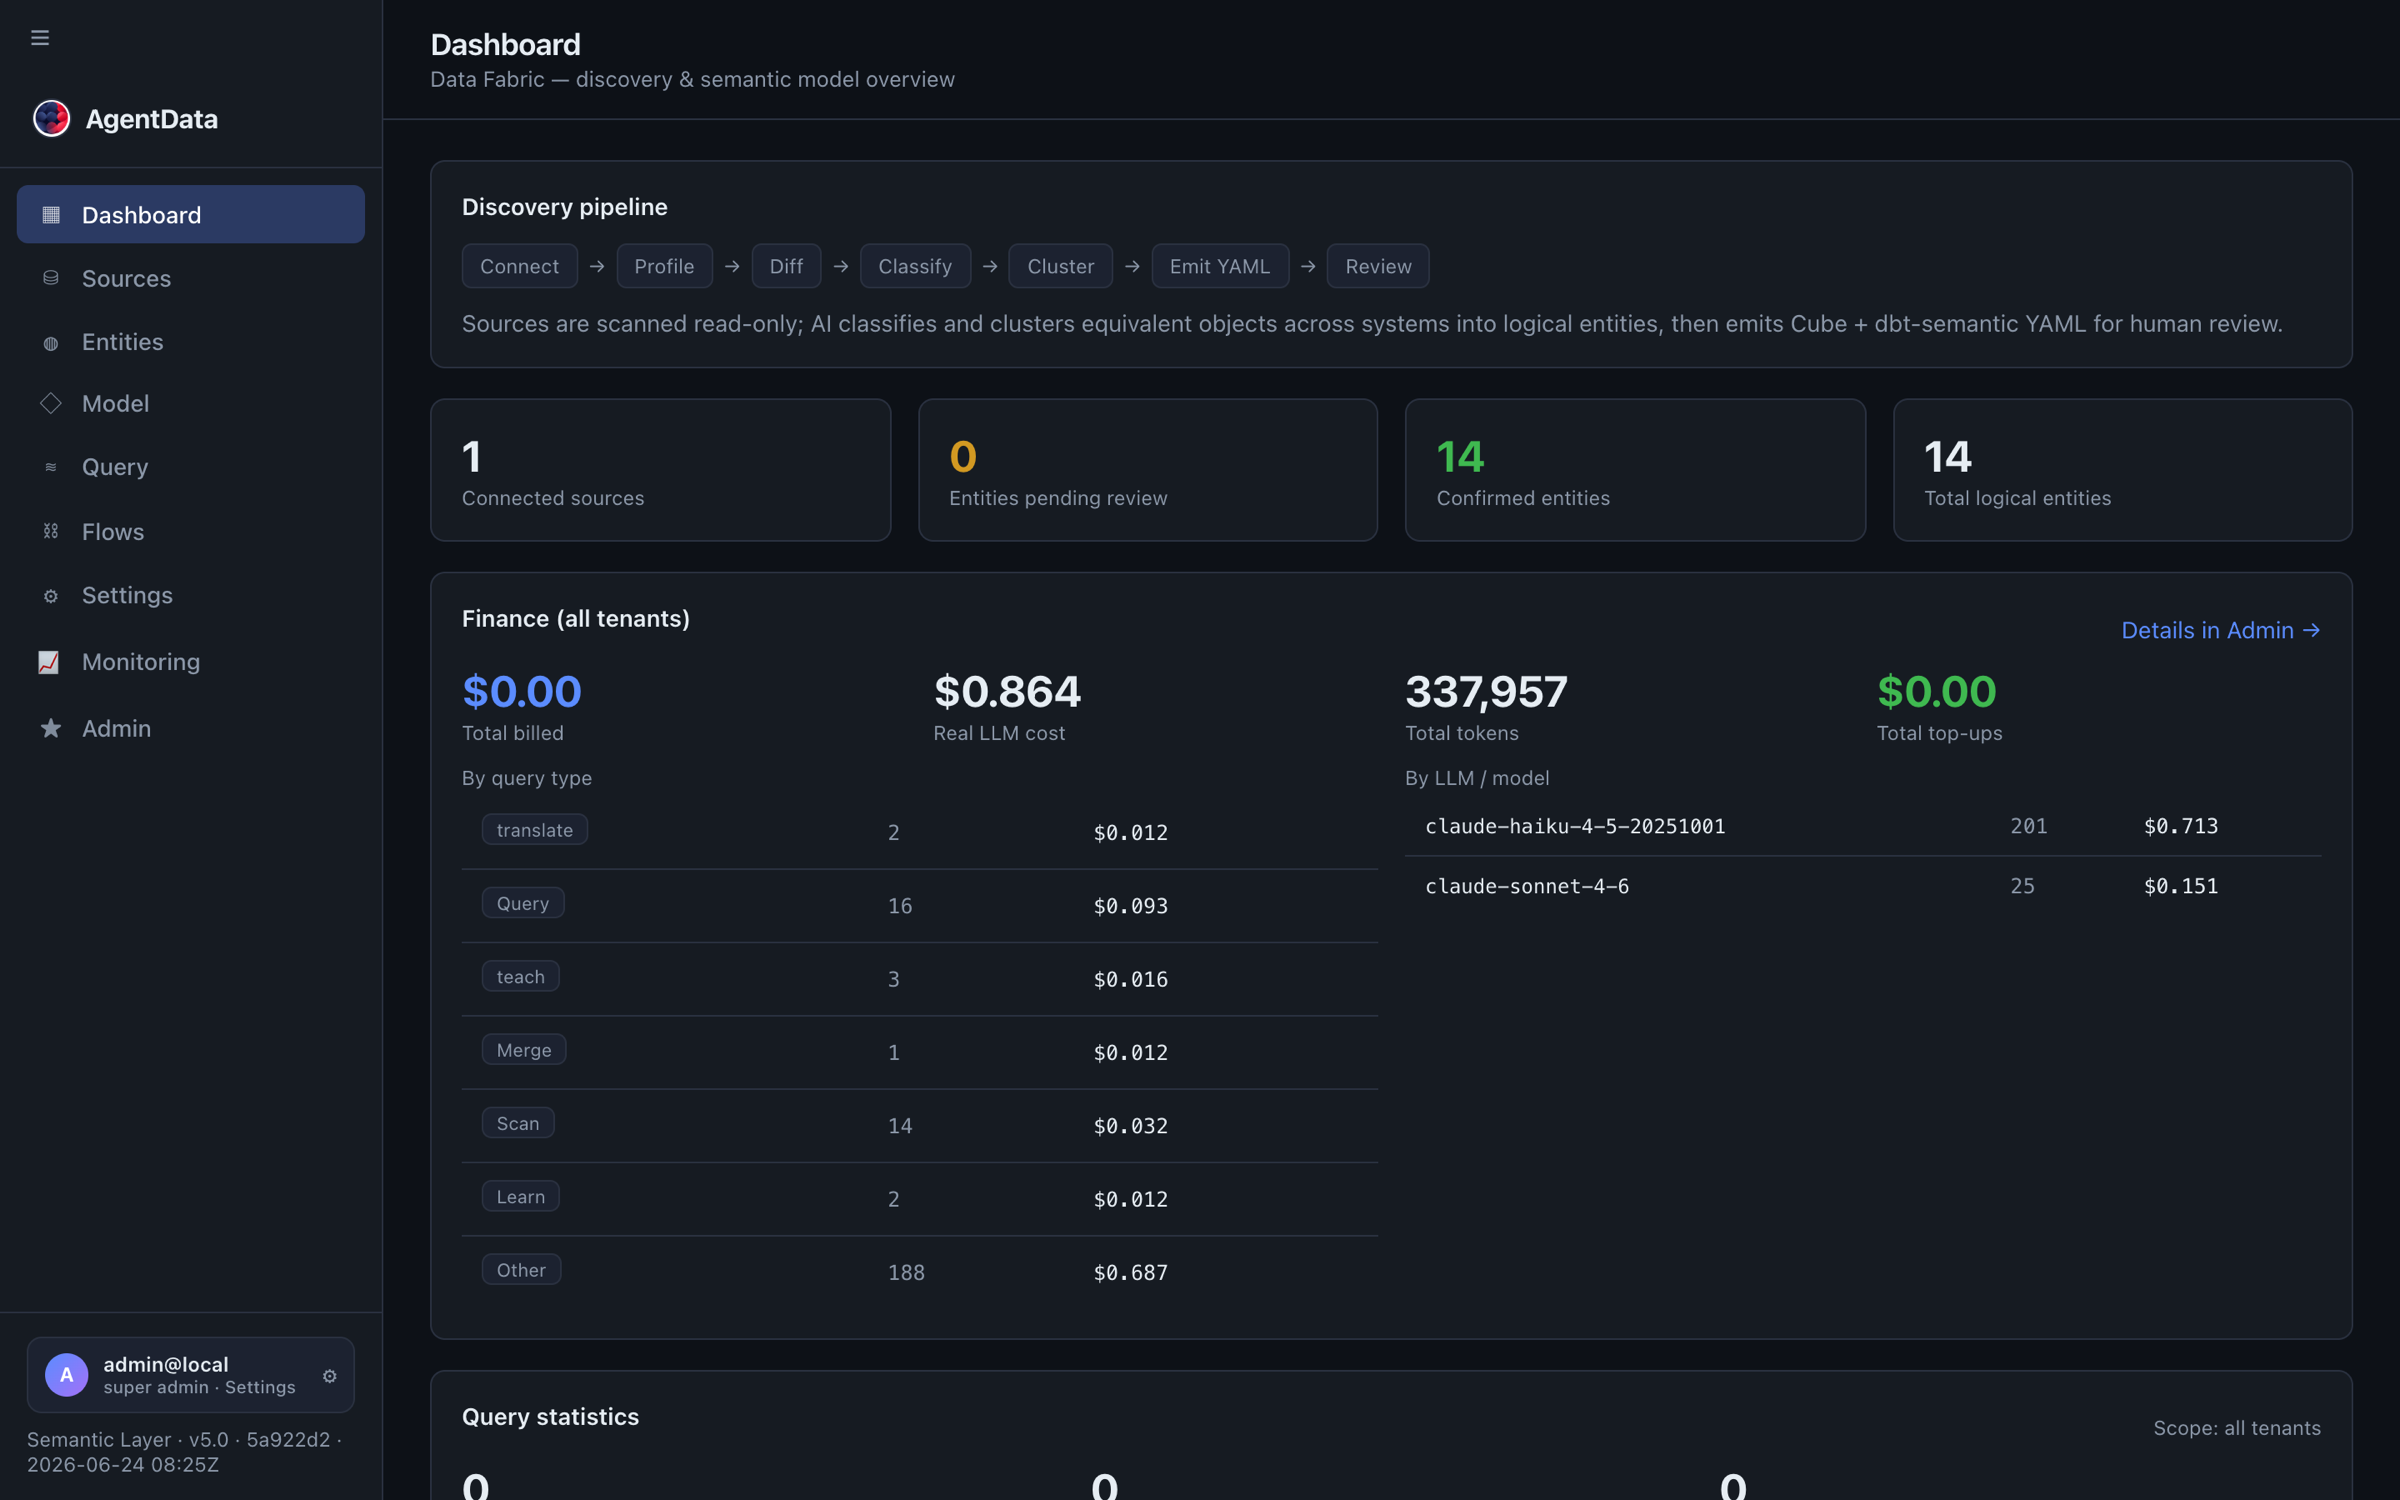
It shows:
- the discovery pipeline and model snapshot — connected sources, pending vs confirmed entities,
- the LLM balance banner (for metered tenants) with top-up request and coupon redemption,
- usage & cost broken down by query type, by model, and by user — with pie charts — for the selected window,
- query statistics — totals, distinct users, volume by source (UI vs MCP) and over time,
- recent sources and scans, and (super-admin) the system log with CSV/text export.
The Monitoring hub
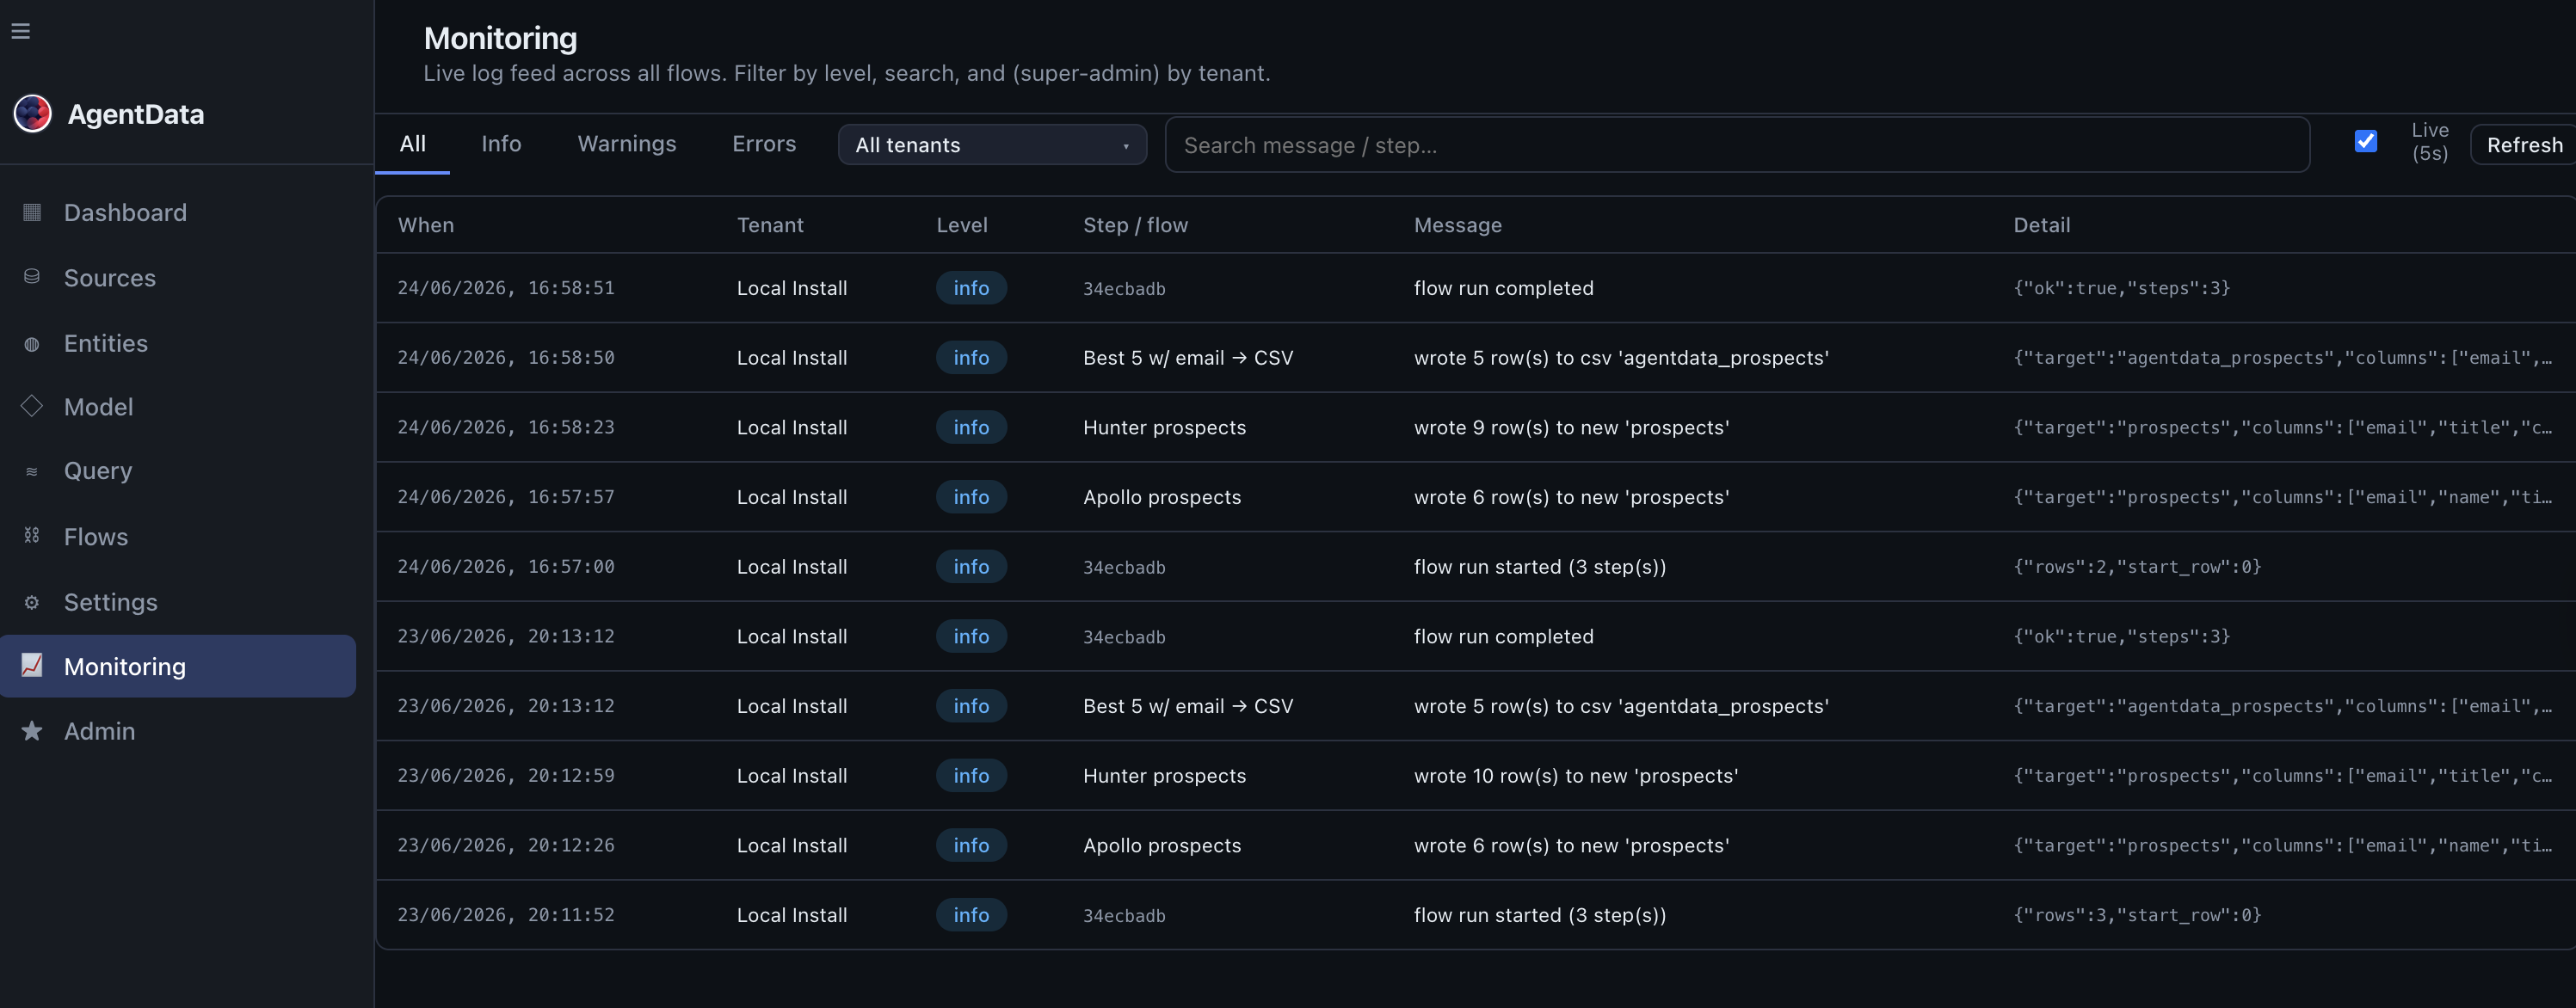
Monitoring is a live feed with a tab per subsystem. Each tab has a super-admin tenant filter and a live-refresh toggle.
Flows
Execution logs for every flow run — timestamp, level (info / warn / error), step description, message and detail. Filter by level or free-text search. This is where you confirm a scheduled load succeeded, or find why one failed.
Queries
Every query executed across the tenant — from the UI, from MCP clients, and from the Data API. Columns show when, source, user, the question, status and row count, with filters for new / reused / error and by source (UI / MCP / Data API). It's the operational counterpart to the History tab.
Feedback
The open feedback queue — user remarks on saved queries awaiting a BA's review — surfaced here as well as inside the Query view, so operators can see what needs attention.
Data API
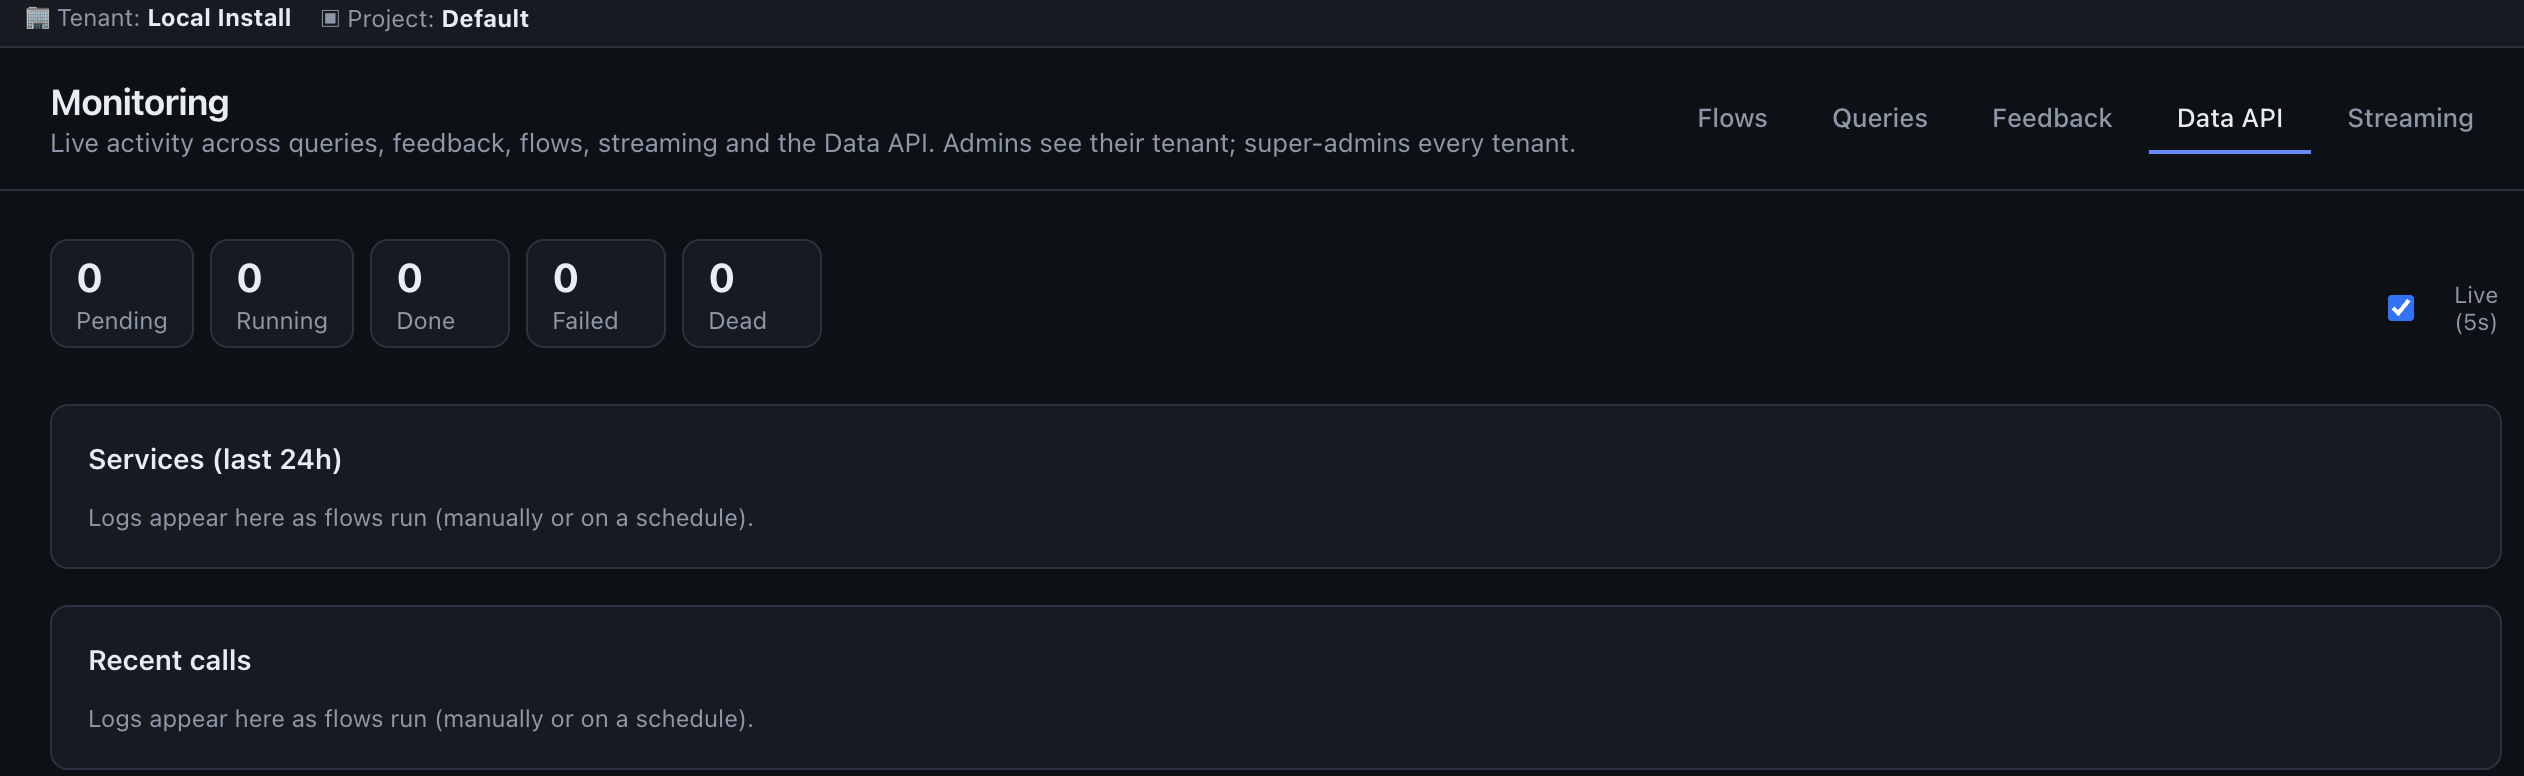
The health of your published Data API services: queue depth (pending / running / done / failed / dead), a per-service table with call counts, error counts and average / p95 latency, and the most recent calls. Use it to spot a slow or failing endpoint before consumers complain.
Streaming
The state of your event streams: the broker mode (internal or cloud) and, per stream, whether it's enabled, its target table, and when it last received an event. (Per-event logs aren't retained — this is the configuration-and-liveness view.)
MCP traffic
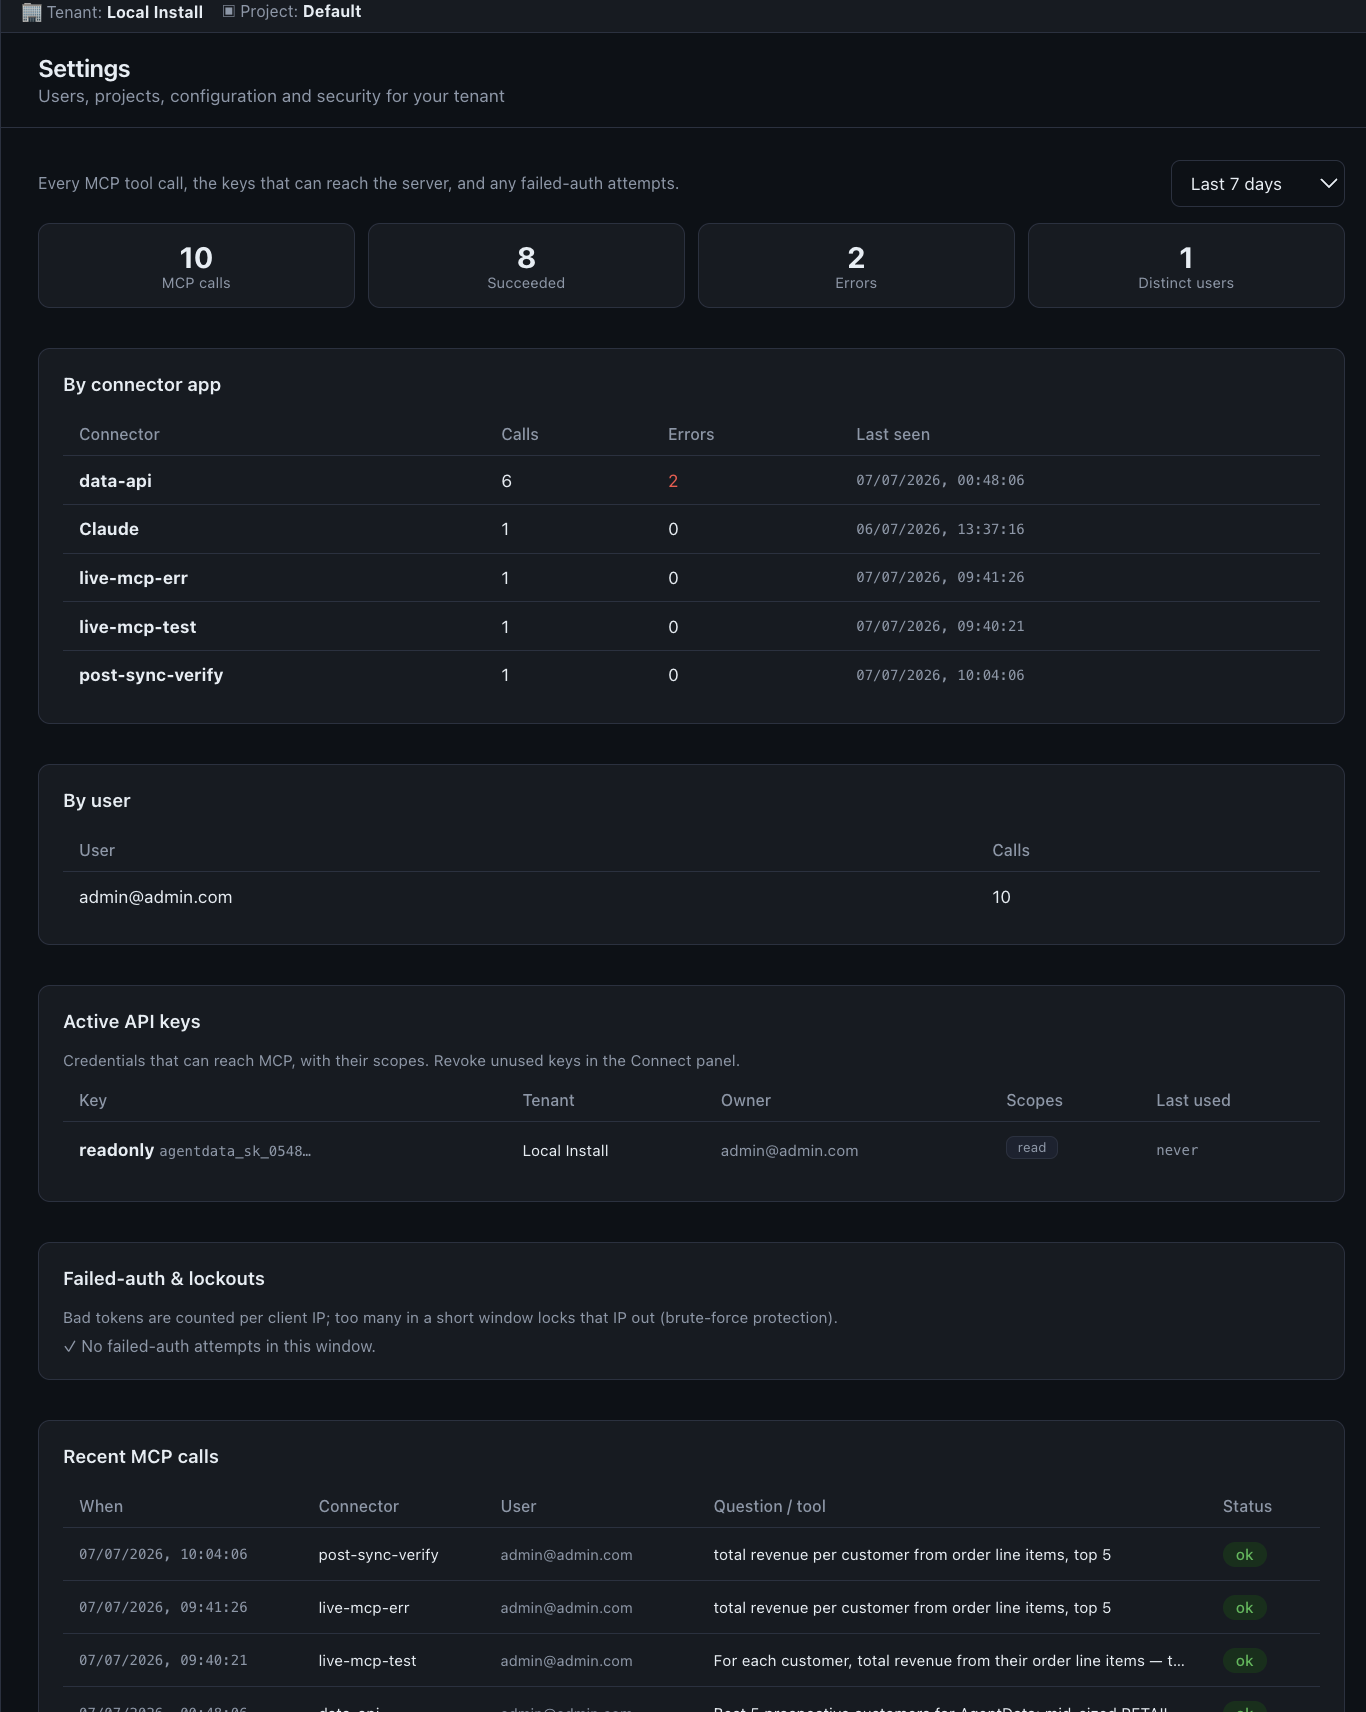
MCP access has its own monitor under Settings → MCP: calls broken down by client app (claude.ai, ChatGPT, Cursor, CLI…) and by user, the active API keys and their scopes, and any failed-auth or lockout events. See MCP server and Security.
Reliability & self-healing
Beyond the dashboards, an optional watchdog runs alongside the stack: it health-checks each component on a schedule, attempts to self-heal a stalled service (restart), and raises alerts (email / Slack) when something needs attention. It's config-driven and runs under launchd (macOS) or systemd (Linux) — see Configuration.
Who can see what
| Role | Dashboard | Monitoring | Scope |
|---|---|---|---|
| viewer / editor | own usage | — | their own activity |
| admin | own tenant | ✓ own tenant | one tenant |
| super-admin | all tenants + filter | ✓ all tenants + filter | every tenant |
Next steps
- Data movement — the flows, streams and endpoints you're watching
- Administration — budgets, retention and configuration behind these numbers
Documents Automation scan monitoring
Documents Automation → Monitoring shows folder inventories, last scan time, counts, partial/offline states and discovery issues. It also shows parsing and extraction jobs, cancellation, result review and publication receipts. See Documents Automation for setup and remediation. Enterprise identity diagnostics are planned with the future Identity & Access panel.