Quick start 4 — build & publish reports
Goal: compose a report from your governed model and hand it to every audience in its native tool: Excel / Google Sheets for the business, Metabase (open source) for live dashboards, Power BI / Tableau / Qlik / OBIEE for the BI estate. ~15 minutes. Requires the model from Quick start 1.
Conversation → Reporting: compose (✨ or by hand) → preview + lineage → publish: download or live push
1. Compose (Conversation → Reporting → Builder)
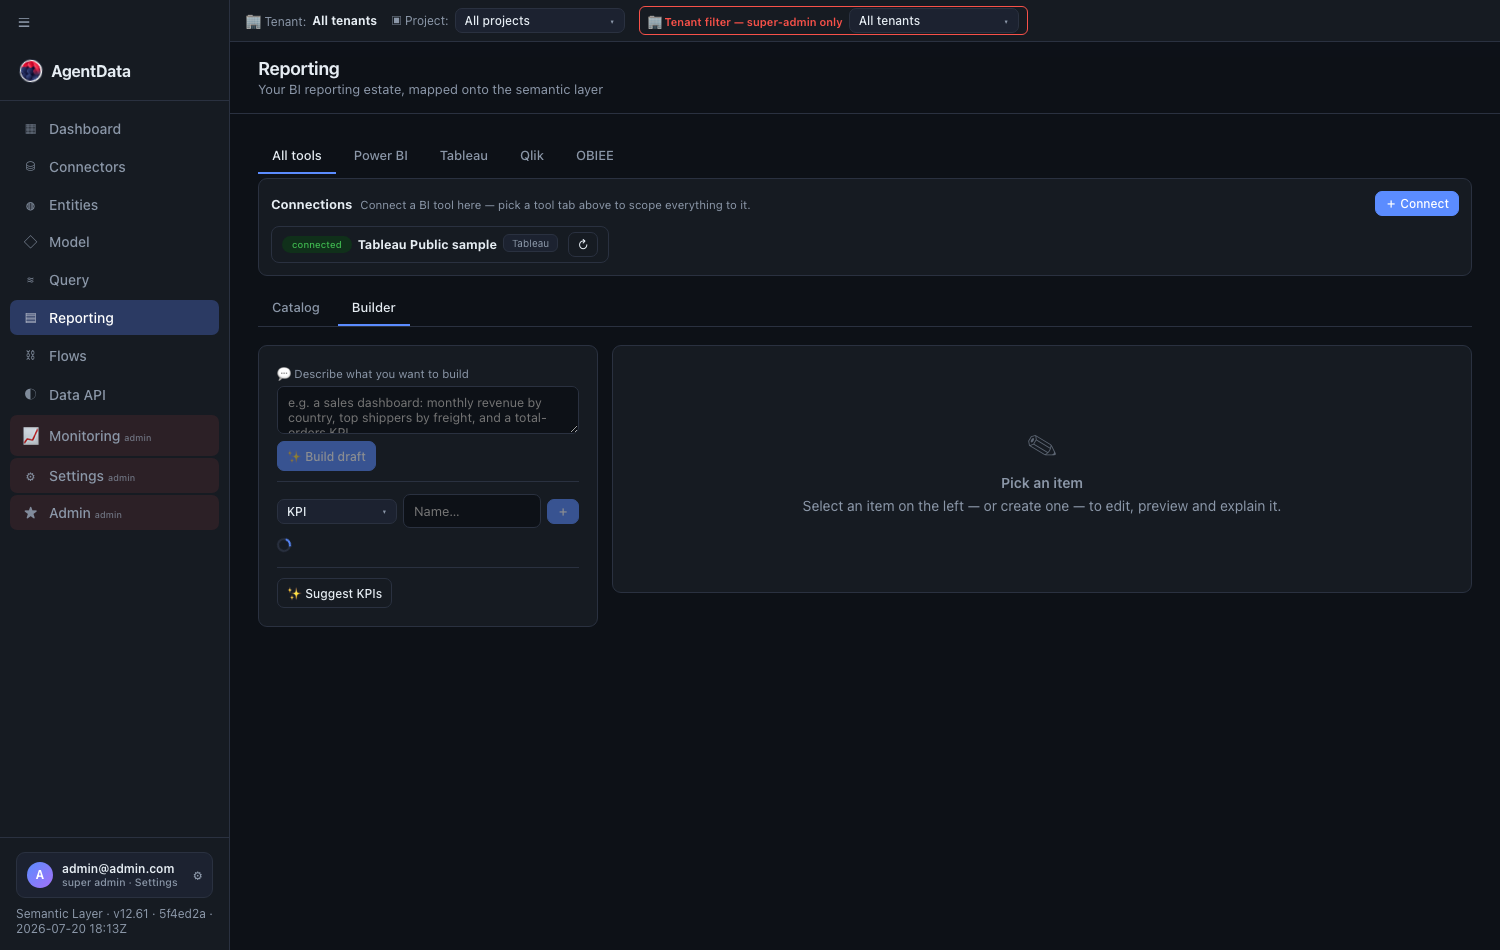
Open Conversation, switch to Reporting, and open the Builder. Two ways to compose:
- 💬 Describe it — "a sales dashboard: monthly revenue by country, top shippers by freight, and a total-orders KPI". The assistant grounds every part in your real entities and measures (never invented SQL), and recommends an existing report first if one already answers the ask — the anti-sprawl guardrail.
- By hand — create KPIs (entity + measure + target) and chart components (bar / line / pie / table over a metric query), then link them into reports and dashboards. Components shared by several reports carry a ⧉ badge — one definition of "revenue", used everywhere.
If the describe-it box is disabled with a provider hint, an admin needs to configure an AI provider (Anthropic, a local OpenAI-compatible server, or Bedrock) in Settings & Monitoring → Settings. The manual builder works without it.
Every part shows a live preview (▶), its query + generated SQL ({ }), and a lineage graph (❄) down to the physical tables — trust built in.
2. Publish
The Publish area at the bottom of the report editor has two groups:
⬇ Download file — pick a format and export:
| Format | You get |
|---|---|
| Excel | A self-managed .xlsx: data sheets + live SUMIF formulas + native charts — keeps working as you edit it. Opens unchanged in Google Sheets / LibreOffice. |
| Power BI | model.bim (TMSL) + a .pbids connection file. |
| Power BI project (PBIP) | A Git-friendly PBIP/TMDL project folder — Power BI Desktop opens it directly; Fabric REST updateDefinition accepts it. |
| Tableau | A template .twb — one datasource per entity with columns and calculated measure fields. |
| Qlik | A .qvs load script. |
| OBIEE | An analysis XML (OBIEE is read-only by design — a migration wedge). |
⤴ Publish live — push to a connected tool:
- Google Sheets — connect once with a service-account key (right in the publish row); publishing creates a spreadsheet with the same data + formulas structure and returns the link.
- Metabase — the open-source BI tool: connect with
host|api-key; each part lands as a native-SQL card on a new dashboard that stays live against your database. - Power BI — needs a live Power BI connector (Azure AD app) under Connectors. Choose Microsoft Fabric (semantic model + bound report), SharePoint (PBIP ZIP), or Standalone push (executed result rows). See the complete Fabric → Power BI demo.
3. Or start from your existing BI estate
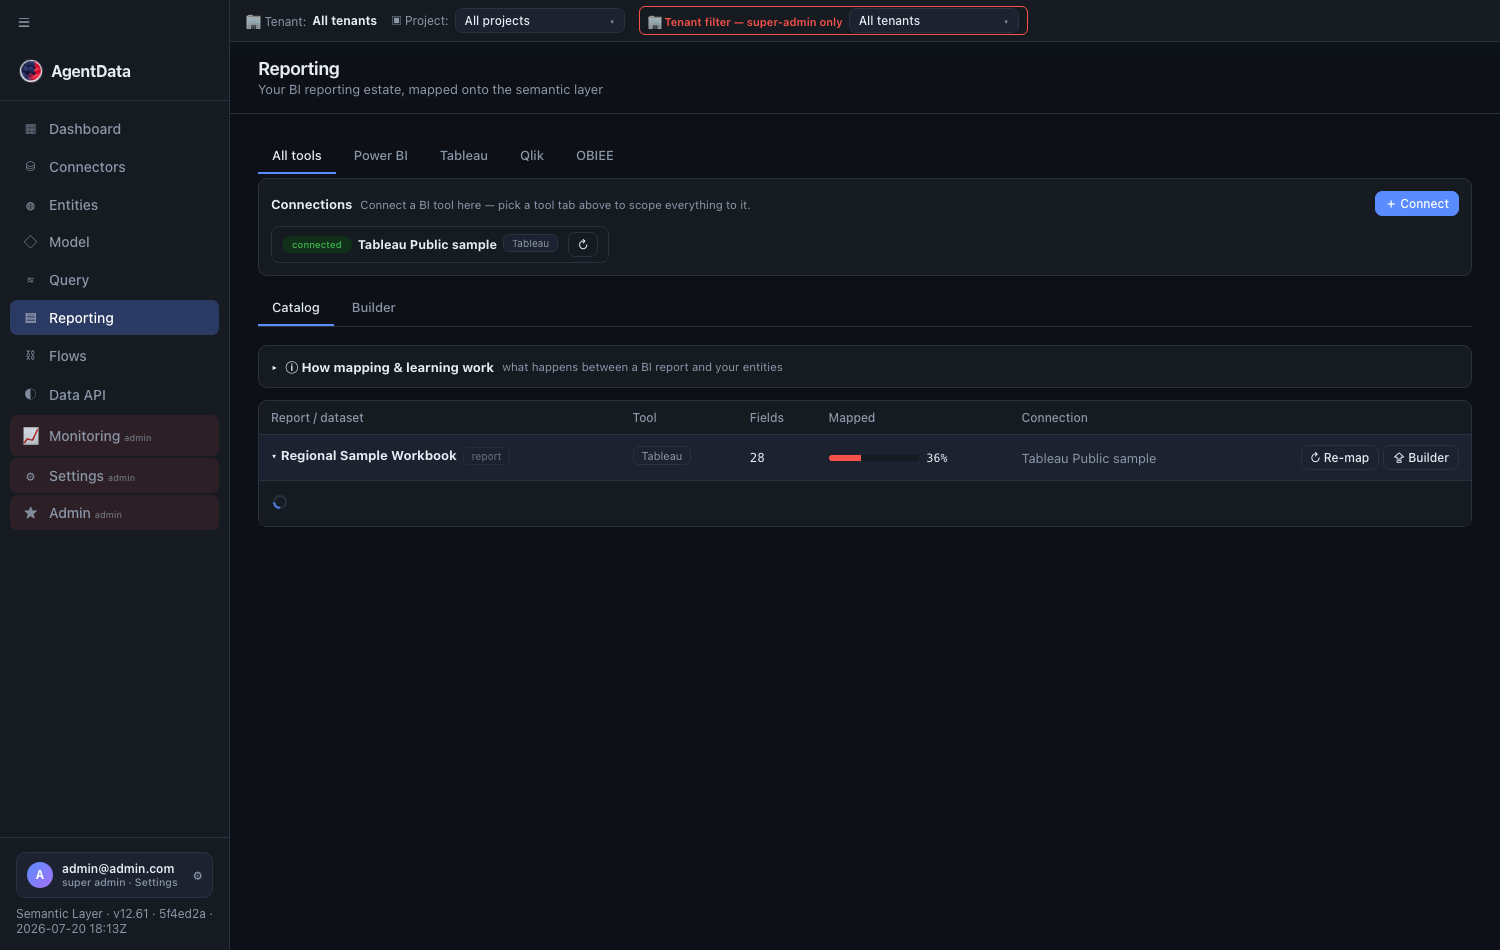
The reporting catalog imports what you already have — Power BI .pbit, Tableau .twb, Qlik .qvs, OBIEE XML, or live connections — and maps every report field down to your tables and entities (custom SQL included, resolved column-by-column). One click (⇪) converts an imported report into editable Builder components; its DAX measures can be harvested into real model measures first.
The full picture — mapping passes, planner hints, measure harvesting, governance — is in Reporting & BI intelligence.
Reporting Services and release limits
SQL Server Reporting Services (SSRS): automatic .rdl generation and SSRS publishing are not currently implemented. Use an approved read-only SQL view/query or governed Data API as a source in Report Builder, retain SSRS-side permissions, then publish through your existing SSRS administration process. This is a customer-managed integration path, not an AgentData publishing button.
Excel and Google Sheets exports are data snapshots; file sharing must be restricted to their approved audience. Metabase, Power BI and other live targets require separately configured credentials, resource permissions and target-specific verification. A generated or bound Power BI report is not evidence that a populated dashboard or Direct Lake connection was certified. Check the active deployment and pilot evidence before promising a live integration. Legacy publication is restricted during enterprise identity cutover.